
FIGURE 5.
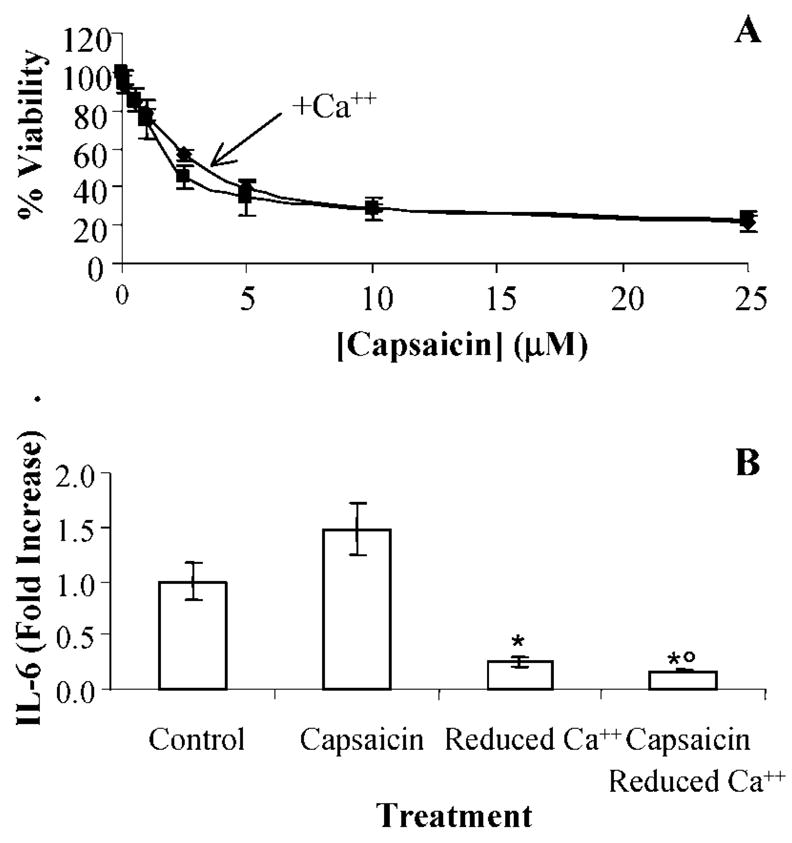
(A) Dose-response cytotoxicity data for TRPV1-overexpressing cells treated with increasing concentrations of capsaicin in complete (diamonds) and calcium deficient (squares) cell culture media. Data represent the mean and standard deviation (n = 4). Statistical differences (p ≤ 0.05) were not observed. (B) Inhibition of IL-6 production by cells treated with capsaicin (1 μM) in complete and calcium-deficient cell culture media. The concentration of IL-6 in media collected from untreated cells was 270 ± 50 pg/mL. IL-6 was lower than complete cell culture media (*) and in cells treated with capsaicin (°) (p ≤ 0.05). Data represent the mean and standard deviation (n = 3).