Figure 2.

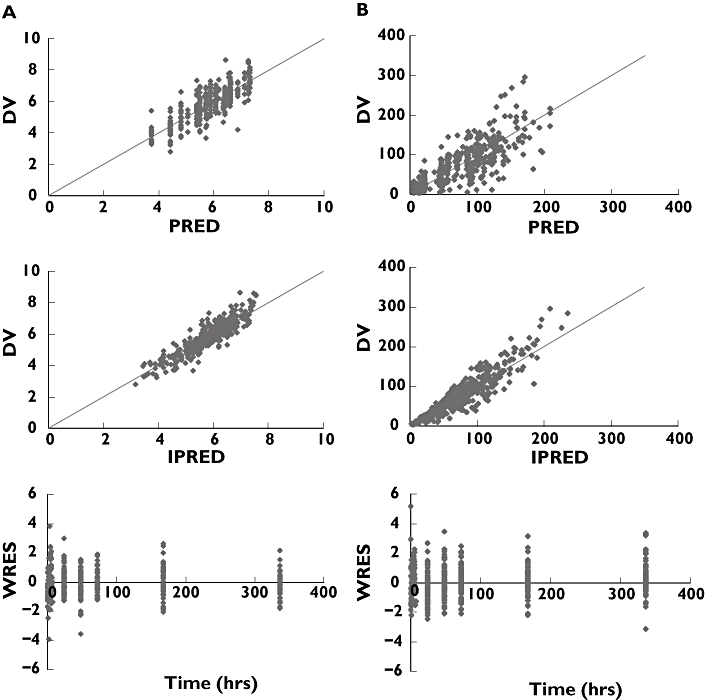
Basic goodness of fit plots (a) CQ and (b) SDx. DV: dependent variable (observed concentrations: log-normalized for the CQ data, linear for the SDx data), PRED, population prediction; IPRE, individual prediction; WRES, weighted residuals

Basic goodness of fit plots (a) CQ and (b) SDx. DV: dependent variable (observed concentrations: log-normalized for the CQ data, linear for the SDx data), PRED, population prediction; IPRE, individual prediction; WRES, weighted residuals