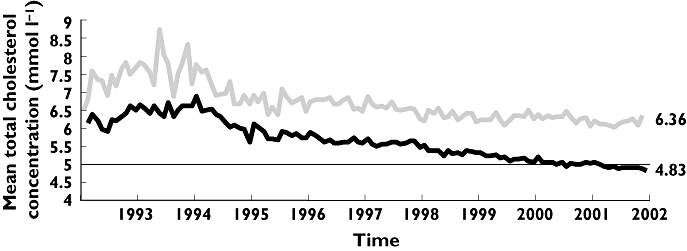
Figure 2.

Baseline ( ) and follow-up (
 ) cholesterol concentration in subjects ever treated with lipid-lowering therapy (intention-to-treat patients), 1993–2002

Baseline ( ) and follow-up (
 ) cholesterol concentration in subjects ever treated with lipid-lowering therapy (intention-to-treat patients), 1993–2002