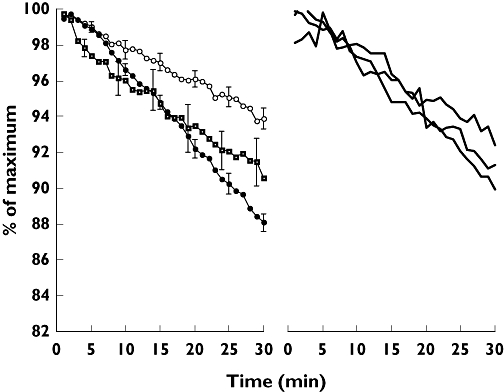
Figure 1.

Left panel: composite 99mTc-sestamibi elimination curves in smokers and nonsmokers with healthy lungs and patients with chronic obstructive pulmonary disease (COPD). Error bars are the standard errors. Note that over the initial 5 min of 99mTc-sestamibi elimination, the mean curves for smokers ( ) and nonsmokers (•) are superimposed and less steep than that for COPD patients (
 ). Right panel: 99mTc-sestamibi elimination rates in the three individual patients with interstitial lung disease (
 )
)
