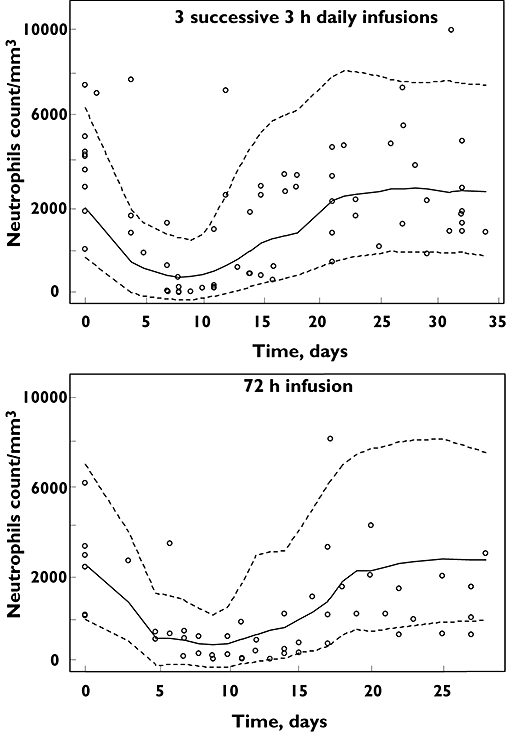
Figure 2.

Visual predictive checks (80%) for absolute neutrophils count time-courses following ifosfamide infusion. o symbols are observed data. Lines are predicted values from 1000 simulations. Dotted lines are the 10th and 90th percentiles. The solid line is the median
