
Figure 2.
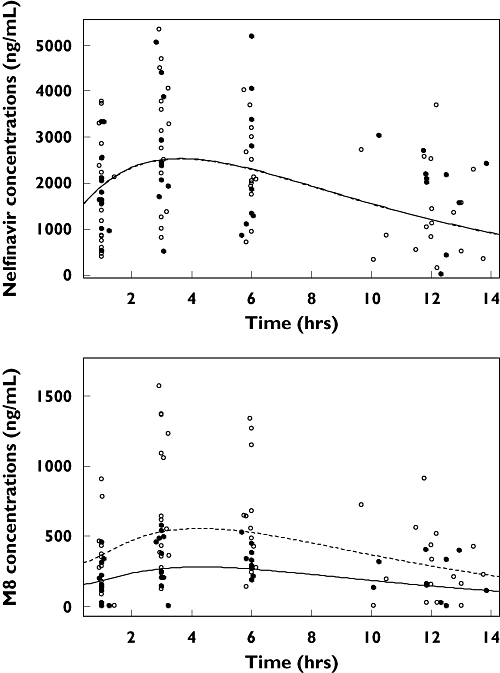
Observed (points) and predicted (lines) plasma concentrations of nelfinavir (top) and M8 (bottom) vs. time: for CYP2C19 wild type, i.e. patients GG for CYP2C19*2 (empty points and dashed lines) and for CYP2C19 mutated patients, i.e. AG or AA for CYP2C19*2 (full points and lines). For nelfinavir, full and dashed lines are superposed