
Figure 3.
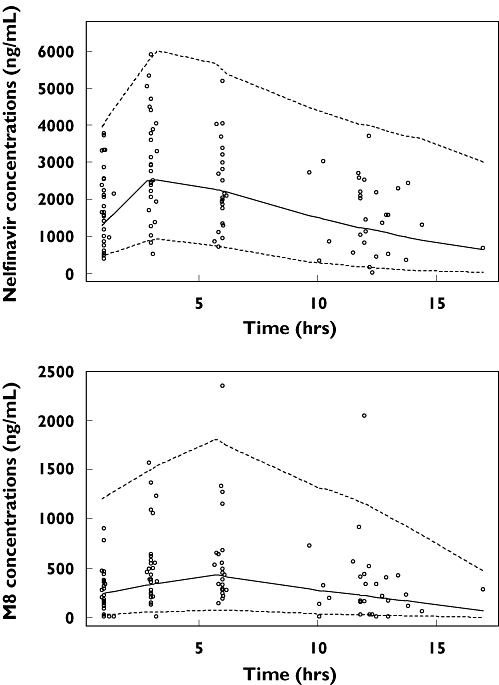
Evaluation of the final model: comparison between the 5th (dash line), 50th (full line) and 95th (dash line) percentile obtained from 1000 simulations and the observed data (points) for nelfinavir (top) and M8 (bottom)
Official websites use .gov
A
.gov website belongs to an official
government organization in the United States.
Secure .gov websites use HTTPS
A lock (
) or https:// means you've safely
connected to the .gov website. Share sensitive
information only on official, secure websites.
Evaluation of the final model: comparison between the 5th (dash line), 50th (full line) and 95th (dash line) percentile obtained from 1000 simulations and the observed data (points) for nelfinavir (top) and M8 (bottom)