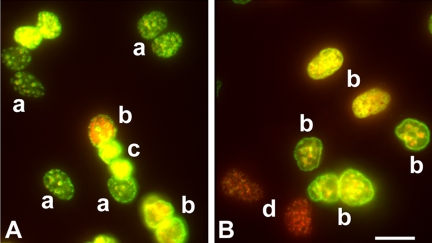
Figure 10.
Cell cycle status of differentiating P19 lines. (A and B) Fluorescence photomicrographs of cells that have been incubated with 100 μM ClDU for 16 h starting 48 h after RA treatment followed by 100 μM IDU for 2 h before fixing and reacting with BrdU antibodies that specifically cross-react with either ClDU or IDU (see Materials and Methods). Specific ClDU labeling was visualized with FITC-conjugated secondary antibody, and specific IDU labeling was visualized with Texas Red–conjugated antibody. (A) P2 cells. (B) A4 cells. (a) Cells that incorporated ClDU at the beginning of the incubation but left the cell cycle thereafter. (b) Cells that incorporated both ClDU and IDU, indicating that they have remained in the cell cycle. (c) Cells that incorporated ClDU, having condensed nuclei indicative of apoptosis. (d) Cells that incorporated only with IDU, indicating an increased cell cycle. Bar 20 μm.

