Figure 3.
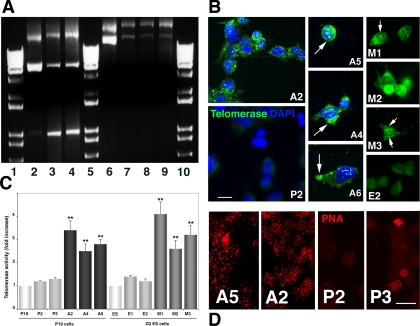
mTERT overexpression in P19 cells. (A) PCR amplification of pBABE puro and PBABEpuro (mTERT). Lanes 2–4, pBABE puro DNA. (2) Plasmid DNA. (3 and 4) genomic DNA from lines P2 and P3. Lanes 6–9, PBABEpuro (mTERT) DNA. (6) Plasmid DNA. (7–9) Genomic DNA from lines A2, A5, and A6. Lanes 1, 5, and 10, 1-kb ladder. (B) mTERT immunocytochemistry. Fluorescent photomicrographs of undifferentiated P19 and ES cells reacted with telomerase antibody. Nuclei were counterstained with DAPI. P19 lines (A2, A4, A5, and A6) and ES lines (M1, M2 and M3) expressing mTERT all displayed immunoreactivity in both the nucleus and cytoplasm (arrows in right panels), whereas P19 and ES cells expressing only empty vector (P2, E2) displayed little immunoreactivity. Bar, 25 μm. (C) PCR-based TRAP assay of telomerase activity performed on 100 ng extract from undifferentiated P19 and ES cells (white bars), the PBABEpuro-expressing P19 and ES lines P2, P3 and E1, E2 (light gray bars), and the PBABEpuro(mTERT)-expressing P19 lines A2, A4, and A5 (black bars) and ES lines M1, M2 and M3 (dark gray bars). Telomerase activity was significantly higher in the mTERT expressing lines than in the control or parent lines or (**p < 0.01) after ANOVA followed by Student's t test. Bar, 25 μm. (D) Hybridization to PNA probe: fluorescent photomicrographs of cells from the PBABEpuro(mTERT)-expressing lines A5 and A2 and the PBABEpuro-expressing lines P2 and P3 were hybridized with the cy3-labeled PNA probe. Hybridization was overall more intense in cells expressing exogenous mTERT, even at day 2 (A2) when hybridization was lower in most control cells (P3). ES cells were similar (not shown). Bar, (A2, A5) 25 μm; (P2, P3) 50 μm.

