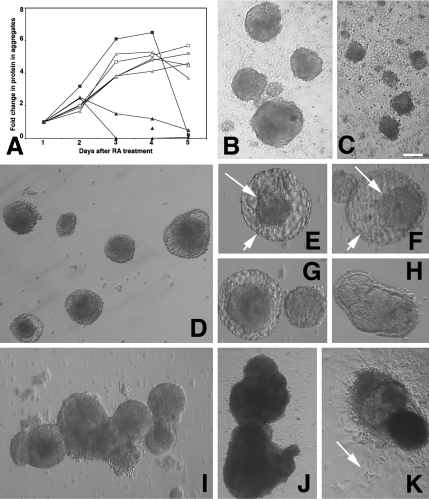
Figure 8.
mTERT-expressing lines in aggregate cultures. (A) Protein content of control and mTERT-expressing aggregates during differentiation. Coomassie-based protein assays of 1 ml aliquots of aggregates from each of the lines taken from days 1–5 after RA treatment as follows: Parent P19s (open triangle); P2 & P3 control lines (grey closed triangles); mTERT expressing lines A2, A4 and A5 (black closed triangles). Note that all line A2 aggregates have dispersed by 3 days (black closed triangle), whereas the protein levels in aggregates from lines A4 and A5 has not increased from day 1. Parent ES cells (open square); E2 ES control line (grey open square); mTERT-expressing ES line M3 (black closed squares). Protein levels fall rapidly as mTERT-expressing ES lines are dissociated for plating onto laminin substrates. (B and C) Live cell images of P19 cells at 52 h after RA treatment. (B) Control line P2. (C) mTERT-expressing line A4. P19s do not form bilayered structures. mTERT-expressing aggregates are smaller and less compact and more cells have dissociated. Bar, 200 μm. (D–K) Live cell images of ES cells during neuroectodermal differentiation. (D–F) Forty-eight hours after RA treatment both parent ES (D) control (E1) line (E) and mTERT expressing line M1 (F) have formed blastocyst-like bilayered structures with an inner cell mass (small arrow) and an outer layer (large arrow). The inner mass increased; day 5 (G), day 7 (H). (I and J) ES cells maintained in suspension culture for 21 d (I) and 121 d (J). (K) Seventy-day aggregates plated onto permissive substrates. Differentiating cells migrate out from aggregates (arrow). Bar, (B–D) 200 μm; (E–G) 60 μm; (H) 200 μm; (I) 500 μm; (J) 2 mm; (K) 1 mm.

