Figure 7.
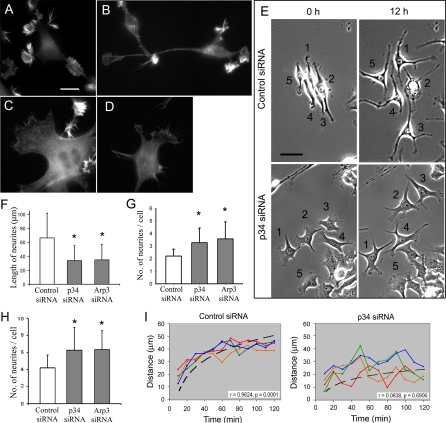
Neuritogenesis is impaired in Arp2/3 complex-depleted B35 cells and hippocampal neurons. (A–D) Phalloidin staining of control (A and B) and p34-Arc-treated (C and D) undifferentiated (A and C) and differentiated (B and D) B35 cells. (E) Mixed population of B35 cells transfected with Cy3-p34-Arc or FITC-control siRNA were imaged immediately (left column) or 12 h (right column) after initiation of differentiation. Numbers mark the same cells at both time points. In the top row, all numbered cells contain control siRNA except cell 2, which contains p34-Arc siRNA, but dies during the movie. In the lower row, all numbered cells contain p34-Arc siRNA. (F and G) Length (F) and number (G) of neurites 48 h after initiation of differentiation in B35 cells treated by control or inhibitory siRNA, as indicated. Asterisks indicate statistical significance compared with control (p < 0.001). n = 152–242 neurites (F) and 63–74 cells (G). (H) Number of neurites in hippocampal neurons 48 h after transfection with control or inhibitory siRNA, as indicated. Asterisks indicate statistical significance compared with control (p < 0.001; n = 56–60). (I) Time course of neurite extension after initiation of differentiation (t = 0) in B35 cells treated with control (left) or p34-Arc (right) siRNA. Each line represents an individual neurite. Dashed lines are curve fitting to a logarithmic function of neurites shown in red in each plot (r, r for plotted variables; p, significance). Bars, 10 μm (A–D) or 5 μm (E).

