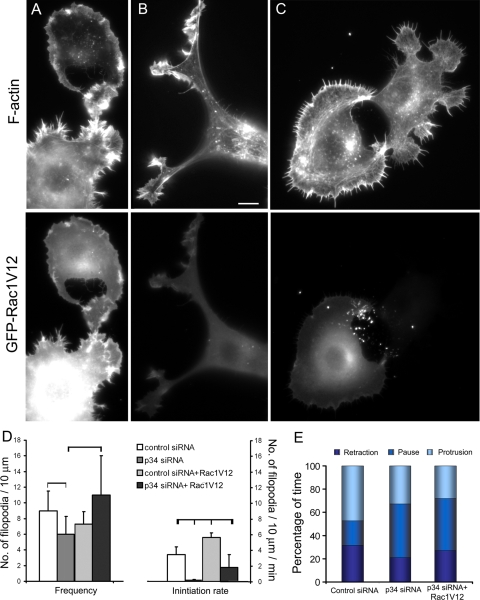
Figure 9.
Expression of GFP-Rac1V12 in B35 cells. (A–C) Phalloidin staining (top row) of differentiated control (A and B) and p34-Arc siRNA-treated (C) cells expressing GFP-Rac1V12 (bottom row). GFP-Rac1V12 and phalloidin image sets are processed identically, so the brightness of fluorescence reflects the level of Rac1V12 expression or F-actin contents, respectively. Representative cell morphologies are shown. (D) Filopodia frequency (left plot) and rates of filopodia initiation (right plot) in cells transfected with indicated constructs. Values connected by brackets indicate statistical significance (p < 0.01; n = 8–19 cells for each). (E) Filopodia dynamics in cells transfected as indicated. Bar segments represent percentage of time spent by filopodia in protrusion, pause, or retraction phases, as indicated (n = 48–119 filopodia). Bar, 5 μm (A–C).

