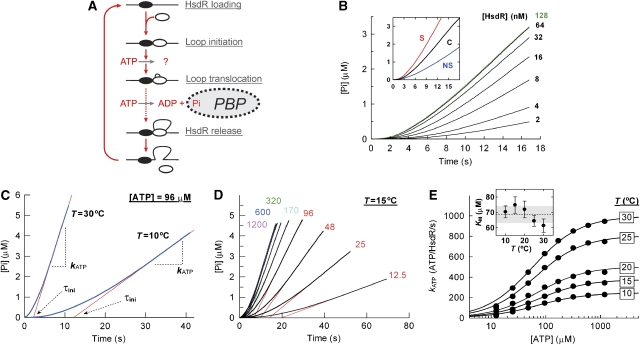
Figure 1.
The temperature dependence of ATP hydrolysis during steady-state loop extrusion. (A) Cartoon showing the cycle of initiation, translocation and termination of DNA translocation by an EcoR124I HsdR subunit (white oval). For clarity, translocation on one side of the MTase only is shown. DNA is shown as a black line and the EcoR124I MTase as a black oval. The binding of free inorganic phosphate by PBP is indicated. (B) Dependence of phosphate release on the availability of free HsdR (concentrations indicated). One-site linearized pLKS5 was at 0.5 nM, MTase at 60 nM and ATP at 80 μM. (inset) Example of background correction at 128 nM HsdR. The phosphate release measured using the specific linear pLKS5 (S) was corrected by the background level using non-specific linear pTYB11 (NS) to generate the corrected profile (C). (C) Example kinetic profiles at 10 and 30°C. The steady-state phase of the reaction was fitted to equation (3) to give kATP; the x-axis intercept gives the initiation time (data not shown; Frieden, 1979). (D) Example of an ATP titration (μM concentrations of ATP indicated), with each profile fitted to equation (3). (E) Hyperbolic dependence of kATP on [ATP] as a function of temperature. Solid lines show fits to equation (4). Statistical error bars are smaller than the scatter of the data points. Fitting to equation (4) was not weighted to either the statistical or systematic errors (discussed in Supplementary data). (inset) Dependence of KM on temperature. Error bars are the standard error of the mean (s.e.m.) of the fitted values. The dotted line shows the average KM across the temperature range and the grey box the associated standard deviation (s.d.). Vmax,calc and s.e.m. (bp/s) calculated from the fits were 246±3 (10°C), 376±7 (15°C), 503±23 (20°C), 807±11 (25°C) and 998±7 (30°C).

