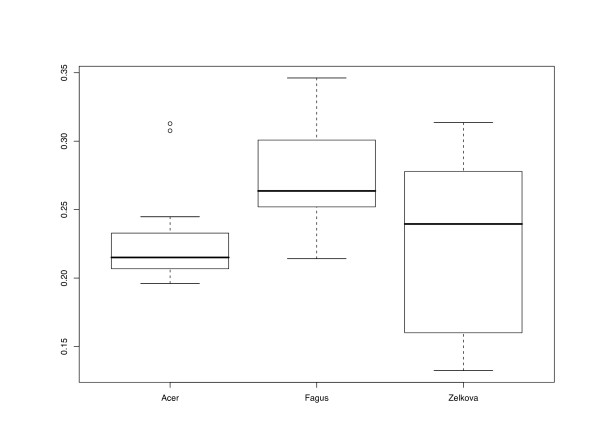
Figure 2.
Data source vs. Delta values. Delta values (computed with DIST_STATS) of distance matrices obtained with a minimum of three associates plotted against data sources, i.e. the plant genera from which the cloned ITS sequences were obtained. Lower Delta values indicate higher treelikeness of the distance matrices. The boxplots indicate the positions of medians (thick horizontal lines), quartiles (boxes), outliers (short horizontal lines connected to the box with dashed lines), and extreme values (open circles).

