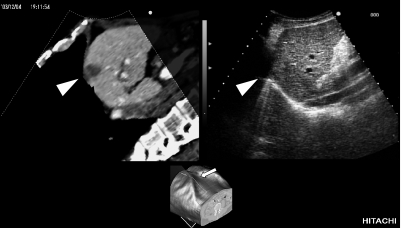
Fig. 3.
Images displayed on the workstation monitor. Moving images are displayed in real-time. Upper left: An MPR image reconstructed during scanning. Arrow head: Hepatocellular carcinoma detected by CTAP. Upper right: Actual ultrasound image. The hepatocellular carcinoma was isoechoic and difficult to detect. Lower: A reconstructed image of the trunk region based on CT volume data. The arrow indicates the location of probe scanning ascertained from positional information gathered by the magnetic sensor (arrow). The cross section of this area was reconstructed as an MPR image. MPR: multiplanar reconstruction, CTAP: CT during arterial portography.

