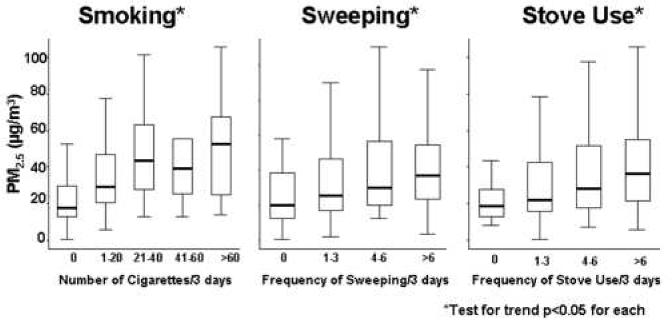
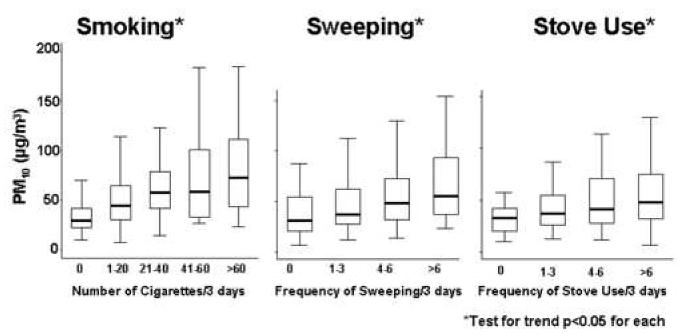
Figure 2a and 2b. Predictors of Elevated Indoor PM2.5 and PM10 Concentrations by Events over the 3-day Period.


Box and whisker plots demonstrate the dose response effect seen with increased frequency of smoking, sweeping, and stove use over the 3-day monitoring period that lead to increased indoor PM levels. The median values are displayed within boxes that contain the middle 50% of PM values. The whiskers extend to the closest value within 1.5 times the interquartile range.
