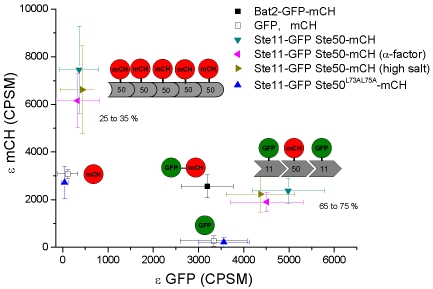
Figure 4. 2dPCH analysis of Ste50-mCherry and Ste11-GFP detects binding stoichiometry.
50 µs bins were used. Data were fit to a one-component model or two-component model, as explained in the text. Symbols and bars represent the averages and standard deviations, respectively. Schematic representations of average stoichiometry observed; possible geometries of the interactions (see main text) are displayed next to the corresponding regions of the graph.

