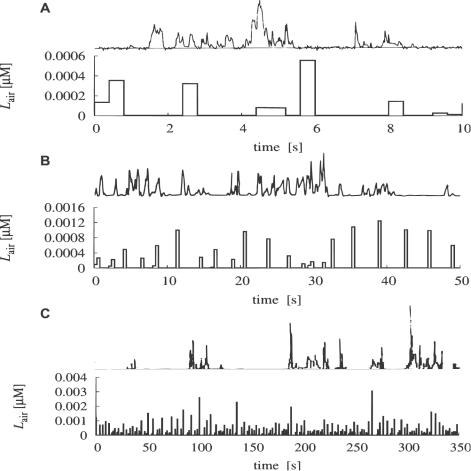
Figure 4. Qualitative comparison of reconstructed optimal pheromone stimulations L air with experimentally-measured fluctuations in concentration of tracers (in arbitrary units), at various time scales.
10 s (A), 50 s (B) and 350 s (C). Temporal positions of pulses in experiments and simulations do not need to coincide. Quantitative comparisons are done in Figures 5 and 6 and in Table 2. (A) Ion signal measured using Langmuir probe in the field, 2.5 m from the source (top, from [17]); theoretical prediction (bottom) shows reasonable correspondence: the temporal resolution Δt = 0.4 s is sufficient to capture the main bursts of pheromone. (B) Ion signal, averaged over 330 ms, distance up to 30 m from the source (top, from [39]); the predicted signal (bottom) captures the overall character of the natural stimulation. (C) Propylene source, 67 m from the source (top, from [18]); the longest pauses (over 1 minute) are caused by the global meandering of the plume: they are absent in the prediction (bottom) because moths are assumed to stay within the pheromone plume.

