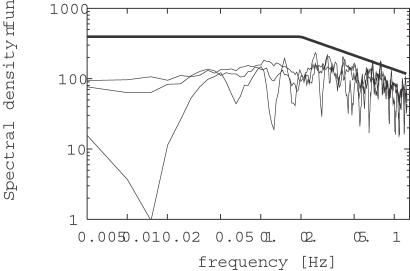
Figure 6. Spectral density functions of the predicted fluctuations in time of pheromone concentration.
Several spectral density functions were calculated from the predicted optimal pheromone stimulations (such as shown in Figure 4, bottom panels), for different initial random seeds. Calculated spectral shapes are usually almost flat from 0.02 Hz to 0.2 Hz, although exceptions are sometimes observed at lower frequencies, which are also found in experimental data [19]. Above 0.2 Hz there is a decreasing slope close to −2/3. Flat spectrum up to 0.2 Hz and true −2/3 slope beyond are shown for comparison (thick line). Spectra from experimental measurements (not shown) on propylene plume obtained close to the source are reported to exhibit a similar flat region followed by −2/3 slope [19].

