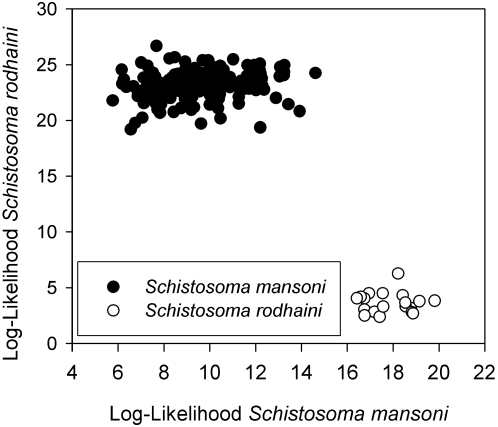
Figure 2. Population assignment graph of S. mansoni and S. rodhaini based on 7 microsatellite markers.
The dot plot indicates the log-likelihood (absolute value) that each individual belongs to either species. The lower the log likelihood value, the more likely the individual belongs to that species.

