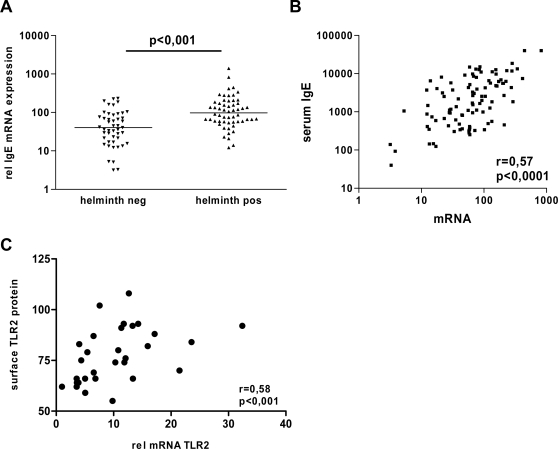
Figure 1. Validation of ex vivo mRNA expression profiles.
(A) Relative IgE mRNA expression in blood of helminth-infected (helminth pos) and non-infected (helminth neg) individuals. Horizontal bars represent median values per group. (B) Scatter plot showing correlation between levels of IgE mRNA and serum levels of IgE. (C) Scatter plot showing correlation between TLR2 mRNA expression in whole blood measured by real-time PCR (16 hours after stimulation) and surface expression of TLR2 by flow cytometry in same samples (24 hours after stimulation).

