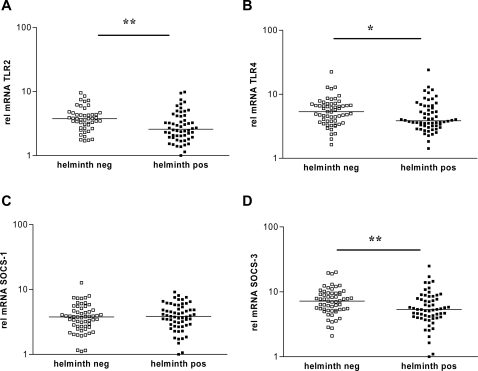
Figure 4. Relative gene expression levels of TLR2, TLR4, SOCS-1 and SOCS-3 in helminth-infected and helminth free children.
Relative mRNA expression levels of TLR2 (A), TLR4 (B), SOCS-1 (C) and SOCS-3 (D) in blood of children positive (helminth pos) or negative (helminth neg) for helminth infection. * p<0.05; ** p<0.01.

