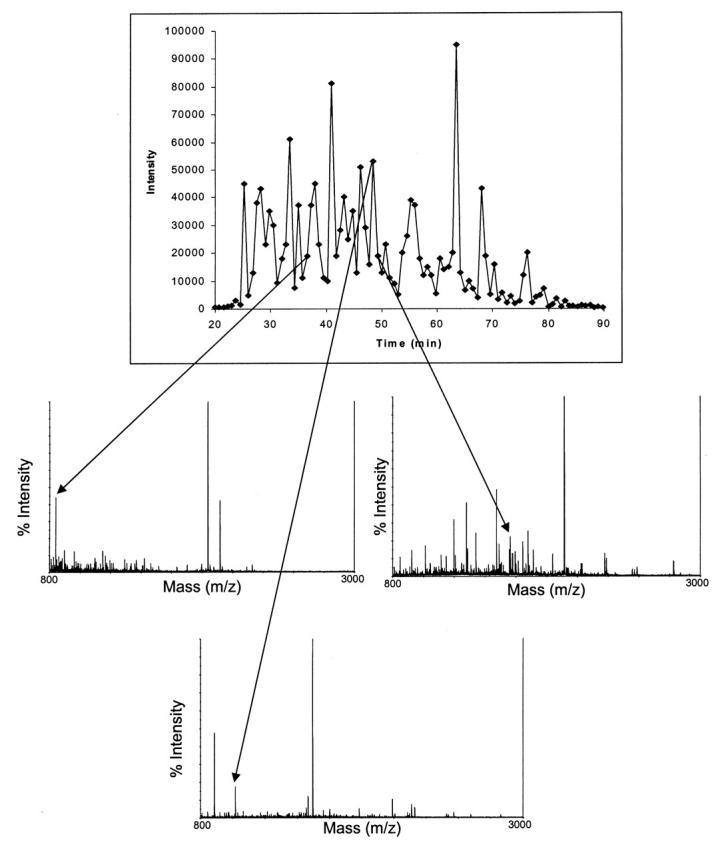
FIGURE 2A.

Base-peak chromatogram generated by the HPLC-MALDI system from a tryptic digest of membrane proteins isolated from the first marine bacterium. Arrows point to the three spectra that correspond to singly charged precursor ions of peptides from protein A. Each point in the chromatogram corresponds to a spot on the MALDI plate.
