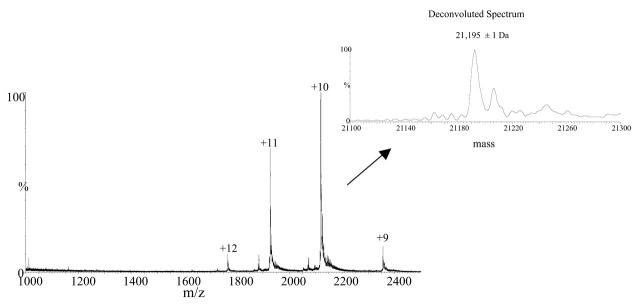
FIGURE 3.
ESI-MS spectrum of holo-siderocalin. The mass spectrum was obtained by averaging 25 scans acquired during elution of the siderocalin complex peak shown in Figure 1. The inset displays the deconvoluted spectrum resulted upon MaxEnt1 processing of the ESI-MS spectrum. The calculated relative molecular weight of the complex is 21,195 ± 1 Da.

