
FIGURE 7.

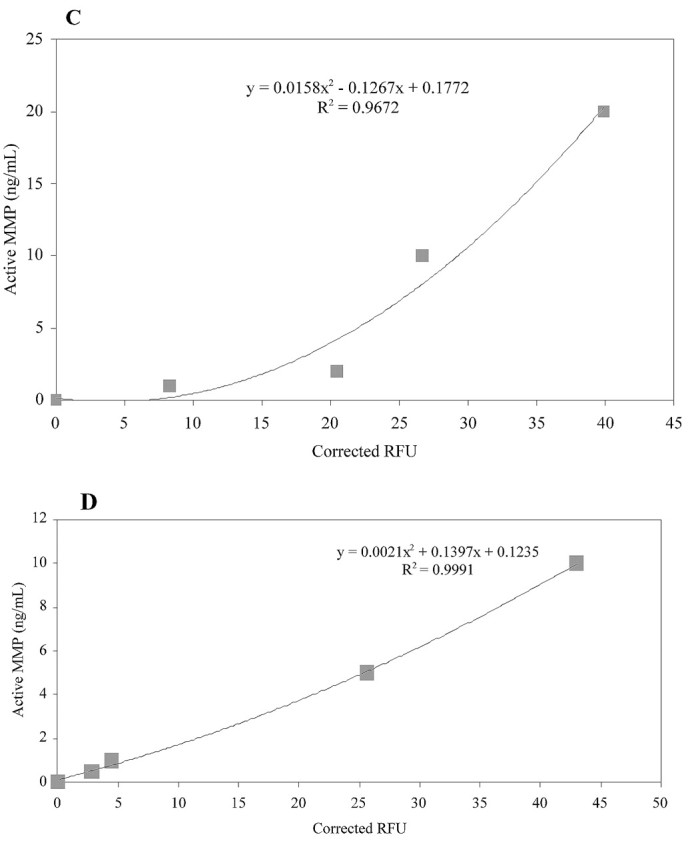
Standard curves for solid-phase MMP activity assay. Active MMP concentration was correlated to a change in substrate (fTHP-4 or fTHP-5) fluorescence using (A) MMP-1, (B) MMP-3, (C) MMP-13, and (D) MMP-14(Δ279–523). The amounts of MMP-1, MMP-3, and MMP-13 added ranged from 1.0 to 20 ng/mL, while a range of 0.5 to 10 ng/mL of MMP-14(Δ279–523) was used. Methods were as described in Results and Discussion. Corrected RFU refers to the relative fluorescence units minus background (no enzyme).