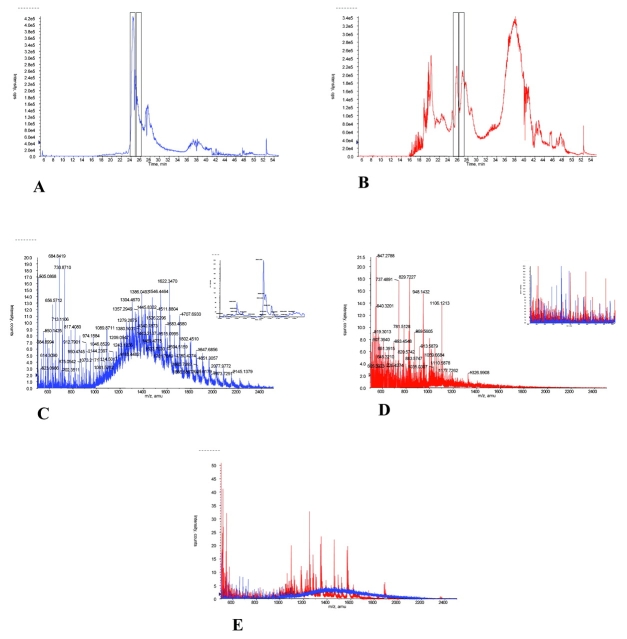
FIGURE 3.
Comparison of serum proteins (1 μg) before and after acetonitrile (ACN) precipitation. Total ion chromatograms for serum proteins before (A) and after (B) acetonitrile are presented. The averaged mass spectra for the cLC elution (taken from 24 to 25 min) of a serum specimen prior to ACN precipitation (C) and after ACN precipitation (D) are shown. Inset in C shows the protein mass graph of the Baysein protein reconstruct performed on the mass spectrum from 900 to 2500 m/z. Inset in D shows the expanded (500–1000 m/z) mass spectra overlay of the pre- and post-treatment samples. E: The overlay of the mass spectra for species present between 25 and 26 min of elution for the two samples is shown. Before ACN precipitation is shown in blue, after ACN precipitation is shown in red.

