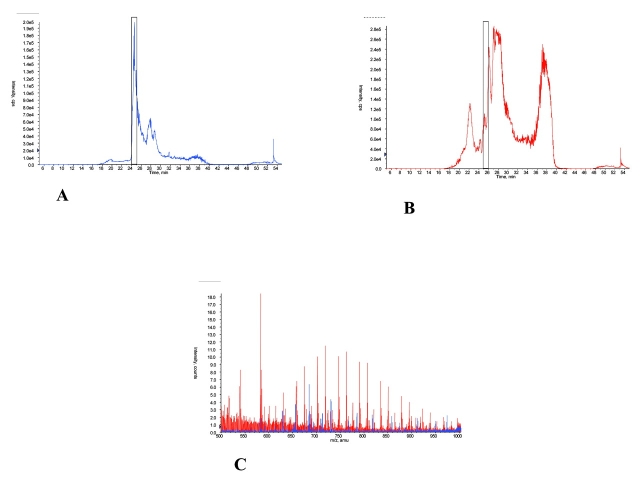
FIGURE 5.
Examination of 30K nominal molecular weight retentate before and after acetonitrile precipitation. Total ion chromatograms of 1 μg of ultrafiltration retentate prior to acetonitrile precipitation (A) and retentate afteracetonitrile precipitation (B) are shown. C: The averaged mass spectra overlay for species present in eluate from 25 to 26 min of the cLC separation step are shown. Retentate prior to acetonitrile precipitation is shown in blue, acetonitrile-precipitated retentate is shown in red. The presence of the high-abundance proteins masked the presence of information-rich small peptides.

