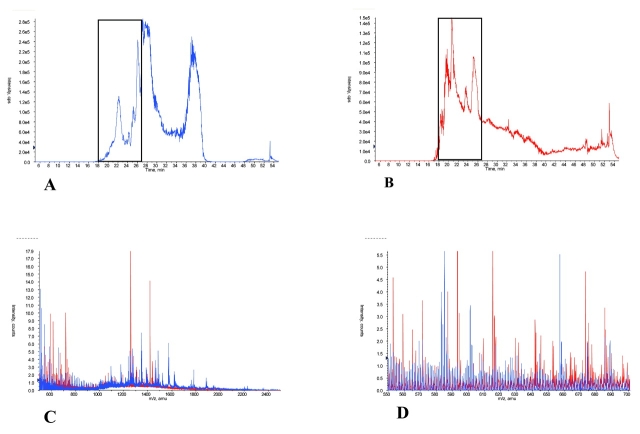
FIGURE 6.
Comparison of acetonitrile (ACN)-precipitated retentate with filtrate. Total ion chromatograms of 1 μg of ACN-precipitated retentate (A) and 1 μg of filtrate (B) from 30 K nominal molecular weight ultrafiltration are shown. C: The averaged mass spectral overlay for 18 to 27 min of the cLC chromatogram is presented. ACN-precipitated retentate is shown in blue; filtrate is shown in red. D: An expanded region (550–700 m/z) of C is shown.

