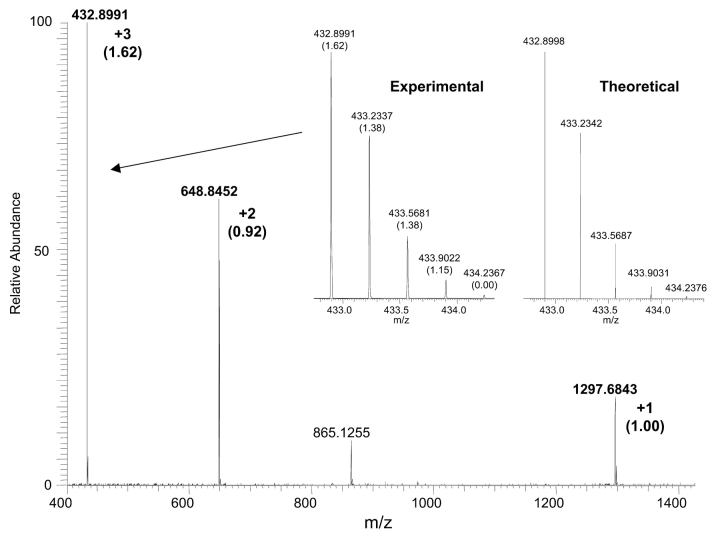
FIGURE 2.
Full scan mass spectrum of angiotensin I showing the +1, +2, and +3 charge states labeled with their mass error in ppm (in parentheses) for the 12C isotope. The inset shows an expanded mass range of the experimental and theoretical +3 charge state distribution with the corresponding mass errors for each isotope.

