
FIGURE 8.
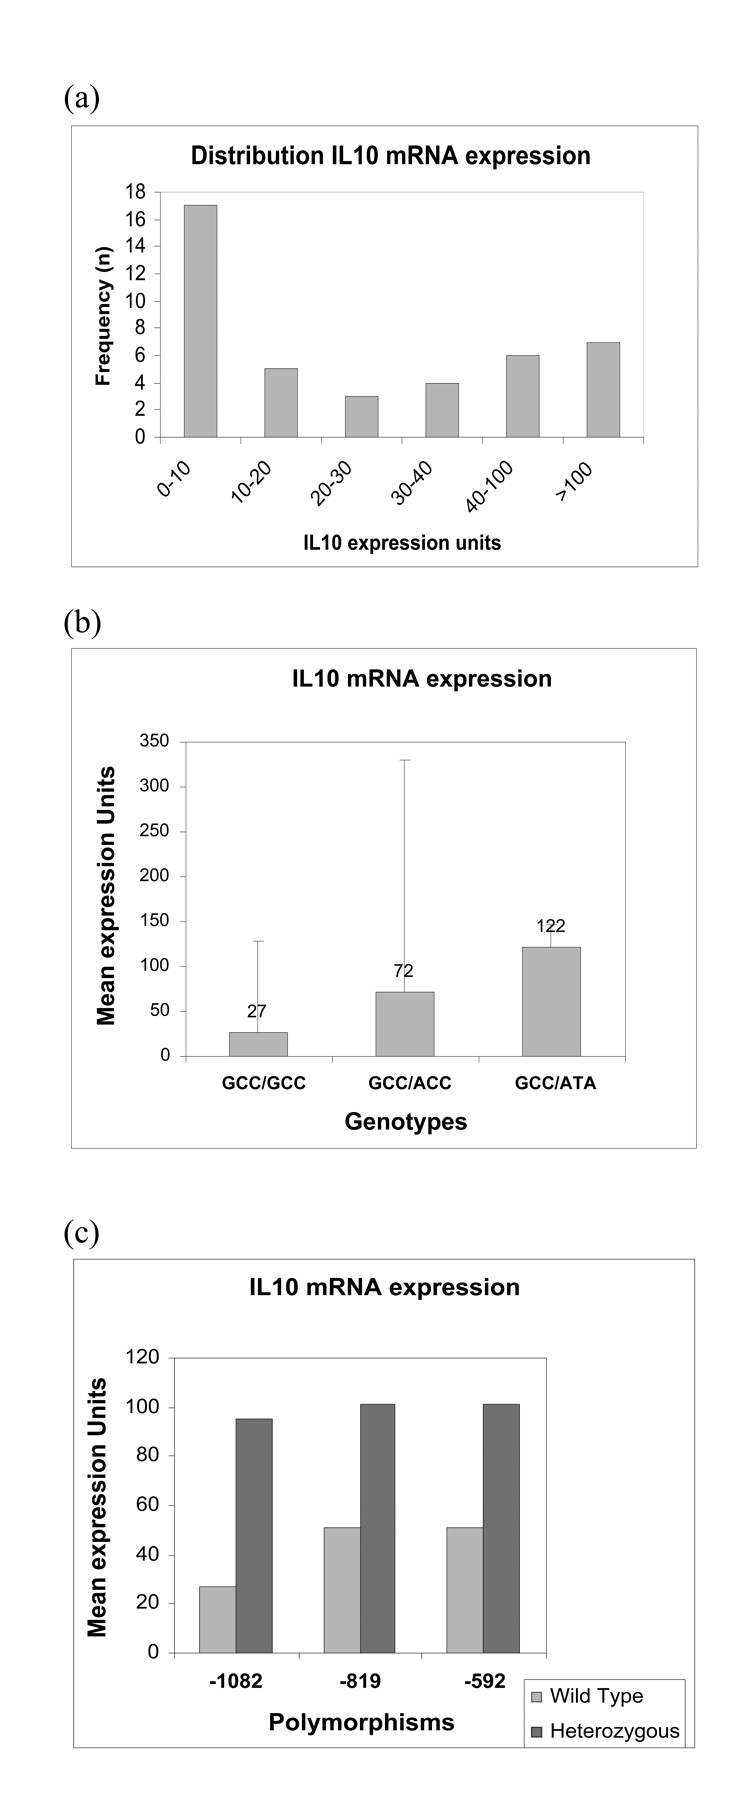
Expression of IL10 mRNA in BrCa samples. IL10 mRNA expression was measured by TaqMan quantitative real time PCR using total RNA from 42 BrCa patients. B-actin was used as endogenous control gene. The difference in Ct values between IL10 and B-actin (ΔCt–ΔCt) was converted to relative mRNA expression units by setting B-actin to 105 and dividing by 2ΔCt. (a) Number of patients vs IL10 mRNA expression levels. A wide distribution is noted among the 42 breast cancer samples tested. Majority of patients (17/42) had mRNA expression units of 0–10. (b) Mean mRNA expression units vs genotypes. mRNA expression levels were higher in the GCC/ATA genotype compared with the GCC/GCC and GCC/ACC genotypes. (c) Mean IL10 mRNA expression units vs the individual polymorphisms. mRNA expression units were higher in the samples with heterozygous mutation compared with the homozygous wild type for all the three SNPs.