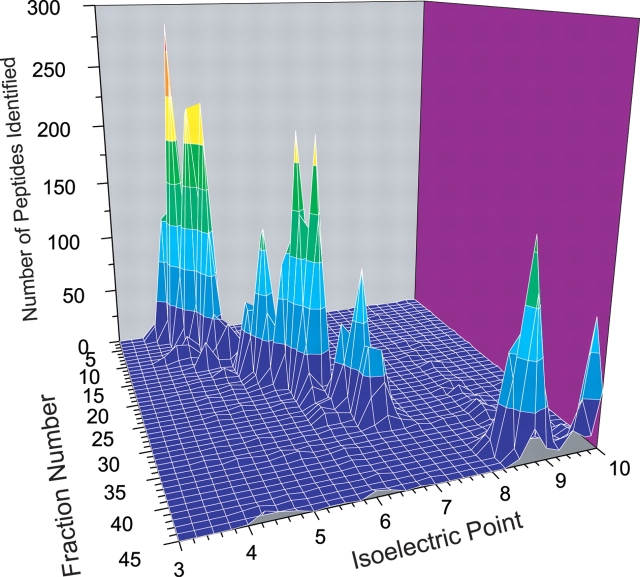
FIGURE 3.
Three-dimensional plot of data obtained from a wide range (pH 3–10) IPG-IEF separation of the soluble E. coli proteome as a function of number of peptides identified, IPG fraction number, and mean peptide pI. (Reproduced with permission from Electrophoresis 2004;25:936–945. Copyright © 2004, John Wiley and Sons.)

