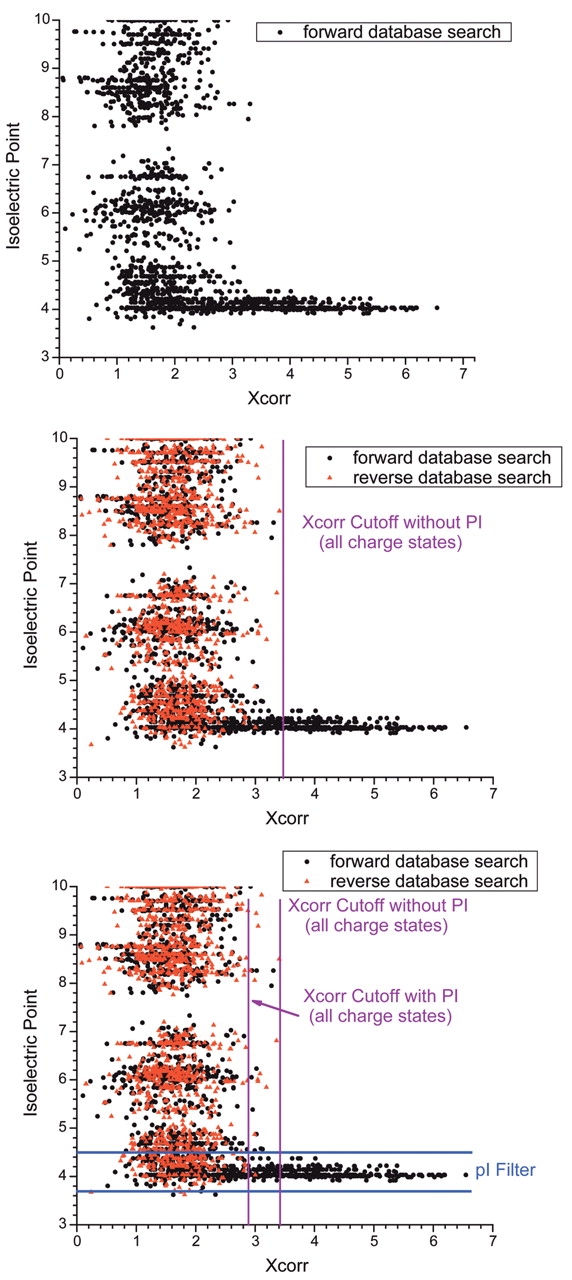
FIGURE 4.

The use of pI as a filtering criterion. The graphs depict all protein hits from SEQUEST searches of an nrIPG-IEF shotgun proteomics analysis of the R. norvigicus testicular proteome, plotted as a function of SEQUEST cross-correlation score (Xcorr) and pI. A: Hits obtained from searching the forward orientation of the database only. B: Hits obtained when the reversed database approach was used to determine Xcorr cutoffs for a peptide false positive identification rate of ~1%. Reversed database hits are shown in red. C: Application of the pI 3.5–4.5 filter to the data, showing that the Xcorr cutoffs can be relaxed while maintaining a false positive peptide identification rate of ~1%. (Figure based on data originally published in reference 12.)
