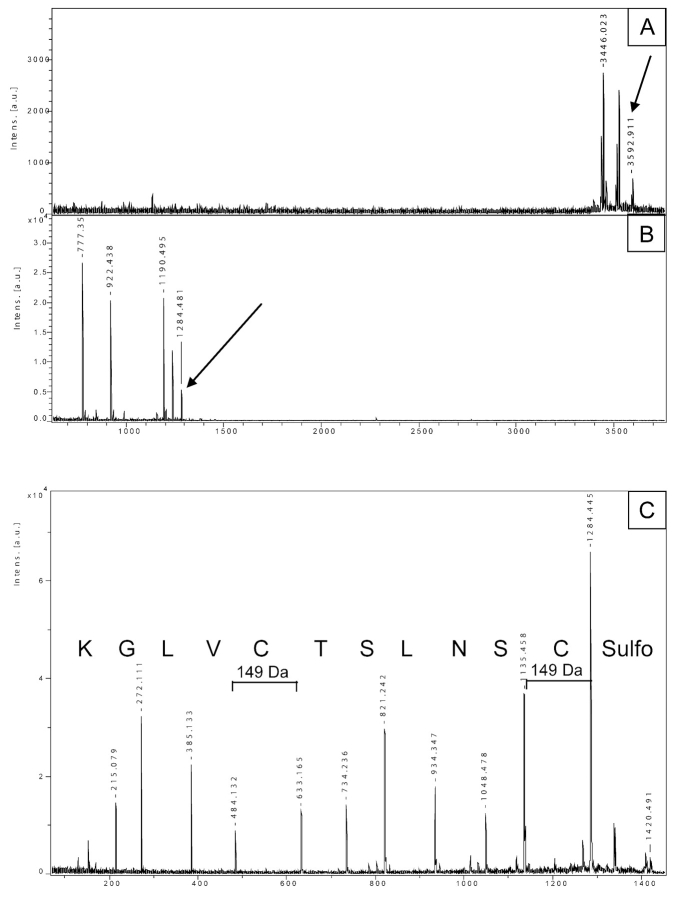
FIGURE 5.
Analysis of cysteine modification of salmon calcitonin. A: Spectrum of the sulfonated protein, with the 3592.9 peak corresponding to the expected m/z. B: PMF of the tryptic peptide mixture, after lysine blocking with imidazole compound (addition of 68 Da). C: Sequence of the peptide 1–11 after sulfonation at the C-terminus (1284 + 136 for CAF labeling = 1420, parent ion). Both cysteines show a mass of 149 Da: 103 Da of cysteine + 46 of a modified sulfonic group.

