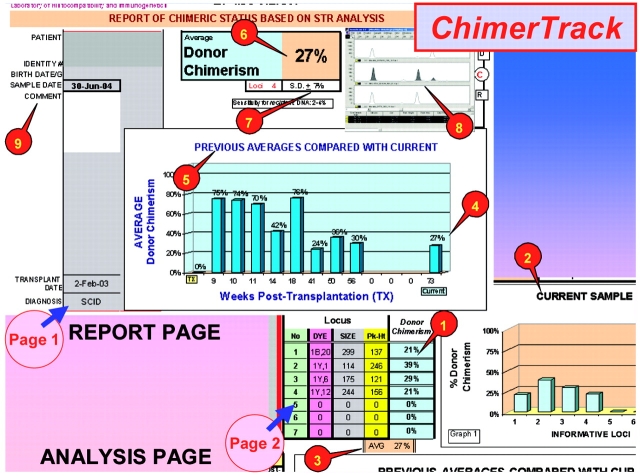
FIGURE 1.
Two pages from the ChimerTrack utility. The first is the report page for the current sample, which is issued to the clinicians. The second page is for posting the results of analysis, and includes data reserved for the laboratory. Nine functions are highlighted by numbered callouts: (1) Tabulated results, showing percent donor chimerism for each locus examined in current specimen; (2) bar graph for visual display of data in the table; (3) average (sample mean); (4) current mean is transferred to bar graph on the report page; (5) bar graph showing comparison of current sample mean with previous sample means, indicating the chimeric trend for the transplant; (6) current mean is automatically transferred to the report; (7) standard deviation for the profile in the current sample (right cell), and the number of informative loci (left); (8) electropherogram image, typical of the chimerism, is pasted here; (9) fields for patient and sample identification.

