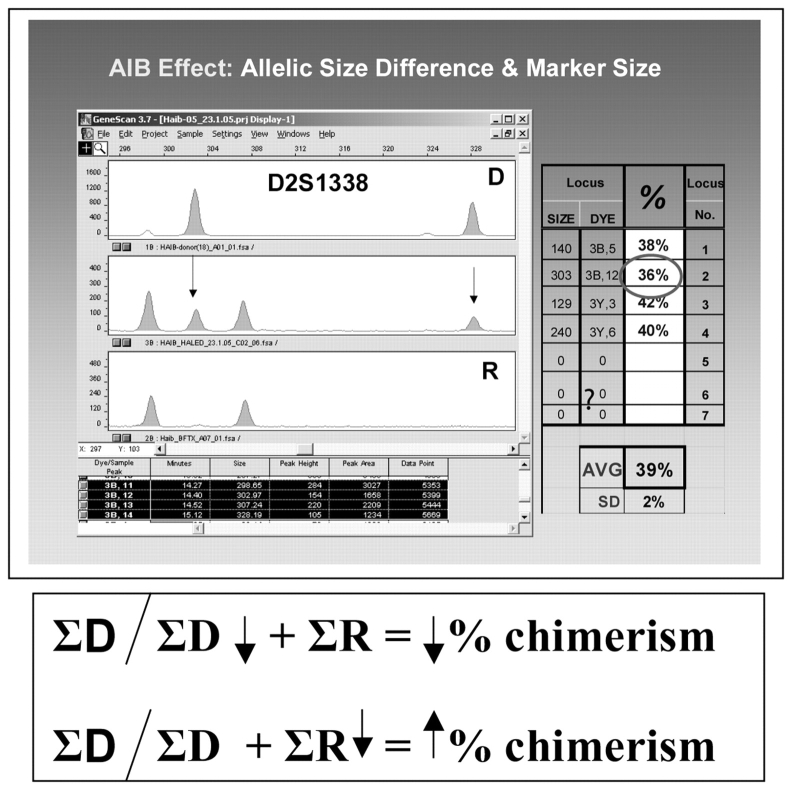
FIGURE 6.
Top: Chimeric sample showing differential amplification effect in the two D (donor) alleles, probably reflecting additive effects of low signal amplitude, allelic size difference, and large marker size. Since the sum of D allele peak areas will be reduced, from the ratio formula we would expect an underestimate of the true value. We do indeed see that this locus is below the profile mean. In this case the variation is sufficiently small that the results could be reported without any further changes. Bottom: Effects of reduction in quantity of R or D DNA on % chimerism.

