
FIGURE 2.
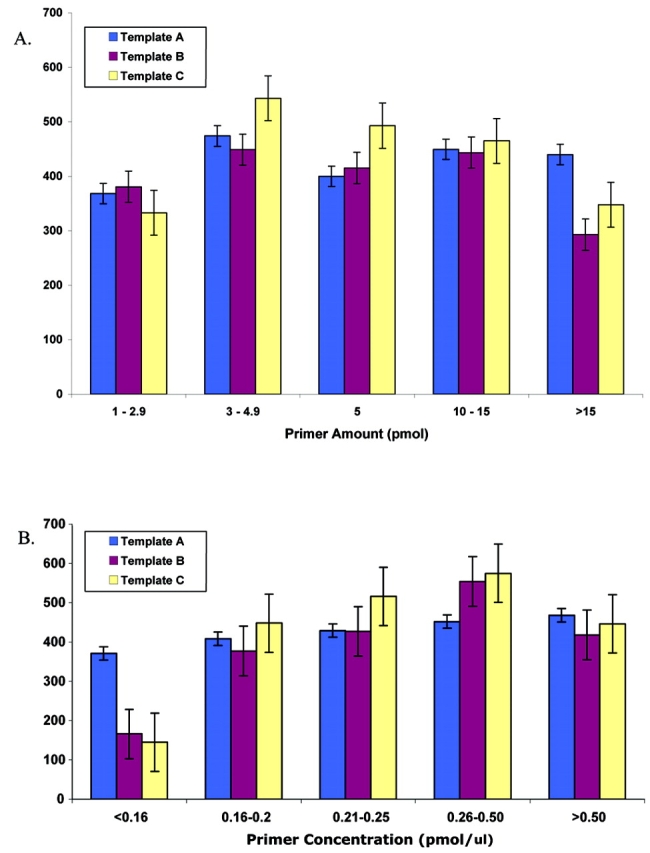
The effect of the amount of primer on sequence quality. A:Results displayed as the exact amount of primer added. B: Primer amounts adjusted for the reaction volume. The bars represent the average and standard errors of the q20 scores for each template (A, B, and C) for the amount of primer used in the sequencing reaction.