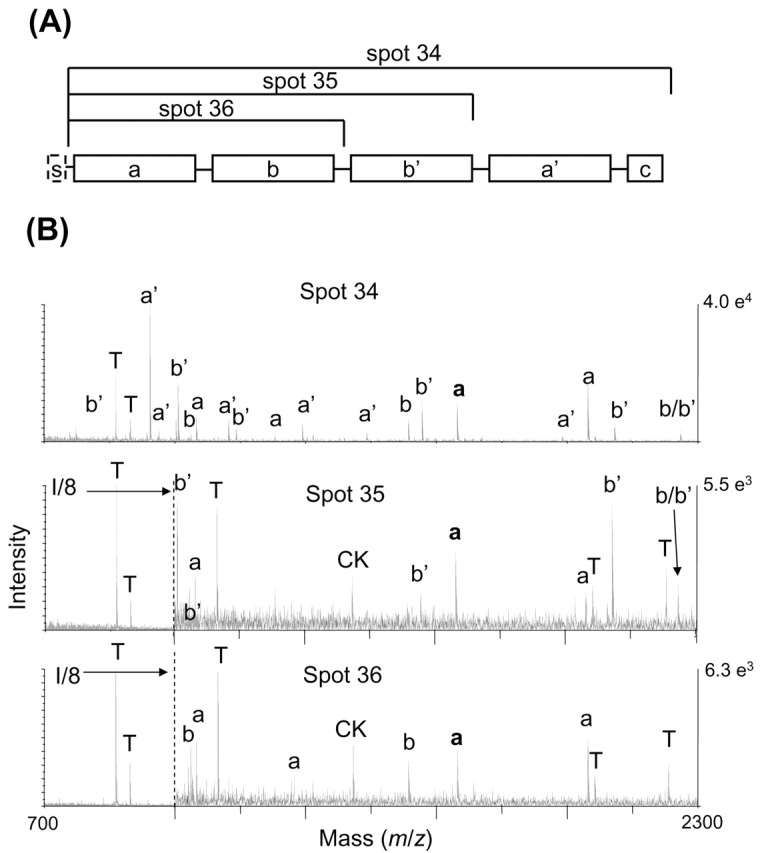
FIGURE 4.

A: Schematic of domains of prolyl 4-hydroxylase β, s-signal; a and a′ are thioredoxin domains, b and b′ are inactive domains; adapted from reference 36. B: MALDI spectra for spots 34–36 with peak labeled according to protein domain. The N-terminal peptide after removal of the precursor protein signal peptide is shown in bold. It is present in all spectra. Peptide labeled b/b′ spans the b and b′ domains. T denotes trypsin autolysis peak, and CK is cytokeratin peak also seen in blank spectrum.
