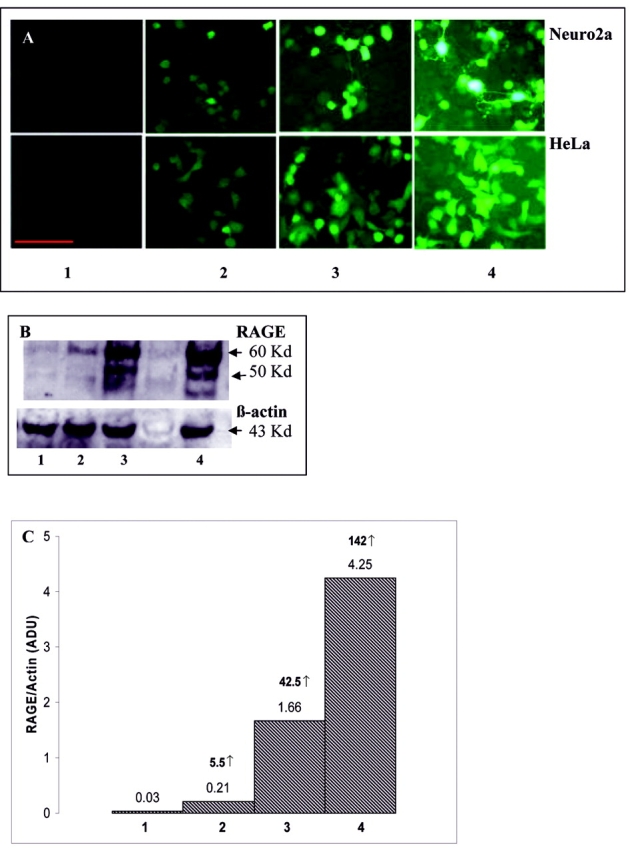
FIGURE 2.

Induction of RAGE expression with different doses of dox. A: EGFP expression in Neuro2a and HeLa cell lines; scale bar: 50 μm. B: Representative Western blot for RAGE, using anti-RAGE monoclonal antibody (Chemicon) and Neuro2a cell lysates. Bands were quantified using imageJ. C: Histogram representing the fold increases in the induction of RAGE expression in response to the different doses of dox. Each bar represents the ratio of RAGE protein to β-actin. The arbitrary densitometric units (ADU) are depicted on each bar and the fold increase relative to non-induced RAGE shown in bold over the bars. 1 = no induction; 2 = induction with 0.1 μg/mL of dox; 3 = induction with 1 μg/mL of dox; 4 = Induction with 2 μg/mL of dox.
