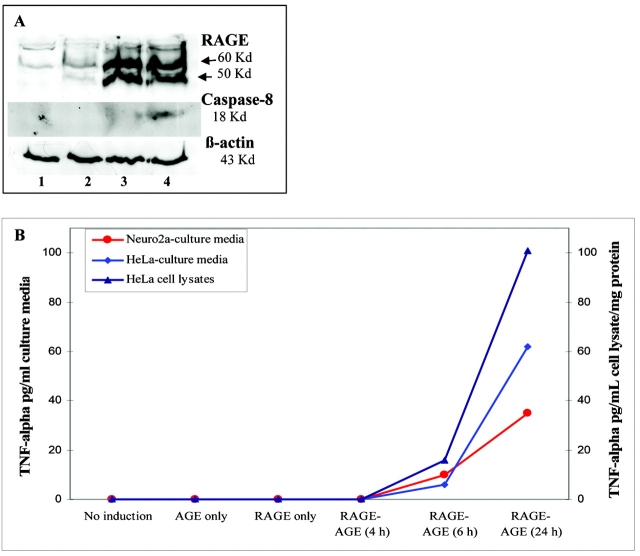
FIGURE 4.
RAGE induction in the presence of AGEs. A: Representative Western blots showing expression of RAGE, caspase-8, and β-actin proteins in Neuro2a cell lysates detected using specific antibodies. Neuro2a cell lysates were collected following transfection (with our inducible expression system) and induction with dox in the presence and absence of AGEs. 1 = no induction; 2 = AGEs only (no induction but supplemented with 50 μm AGEs); 3 = RAGE only (induced with 2 μg/mL dox without AGEs supplements); 4 = RAGE-AGE (induced with 2 μg/mL dox and supplemented with 50 μm AGEs). B: Graph showing ELISA results representing the TNF-α levels in the culture supernatants collected from Neuro2a and HeLa cells and cell lysates from HeLa cells following transfection (with our Tet-inducible system) and induction to express RAGE in the presence and absence of 50 μm AGEs. In culture supernatants, TNF-α levels are expressed in pg/mL of supernatants. The protein concentration in HeLa cell lysates was adjusted to 1 mg protein/mL lysate and TNF-α levels are expressed in pg/mL cell lysate/mg cell protein.

