
FIGURE 9.
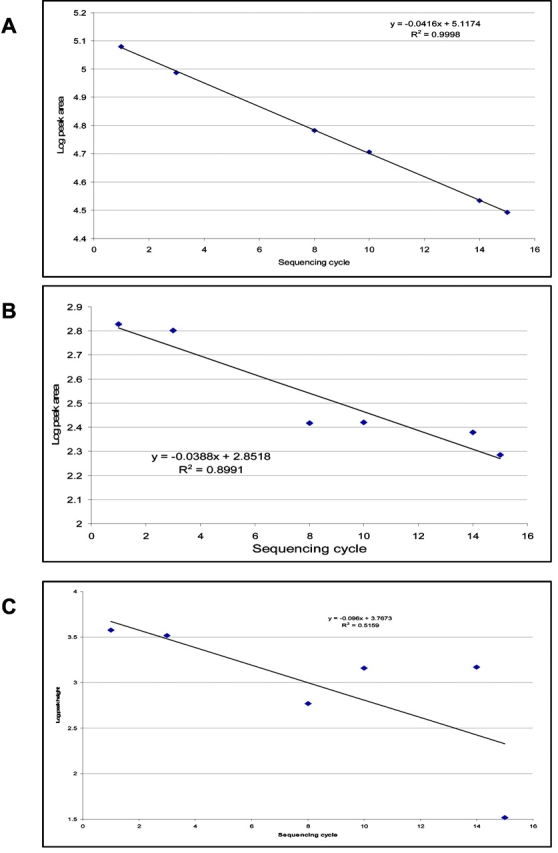
Calculation of repetitive yield from the slope of the trend line through a plot of log of the peak areas for Tyr and Ala residues as a function of sequencing cycle. (A) Repetitive yield of excellent quality, (B) repetitive yield of intermediate quality; and (C) repetitive yield of poor quality.