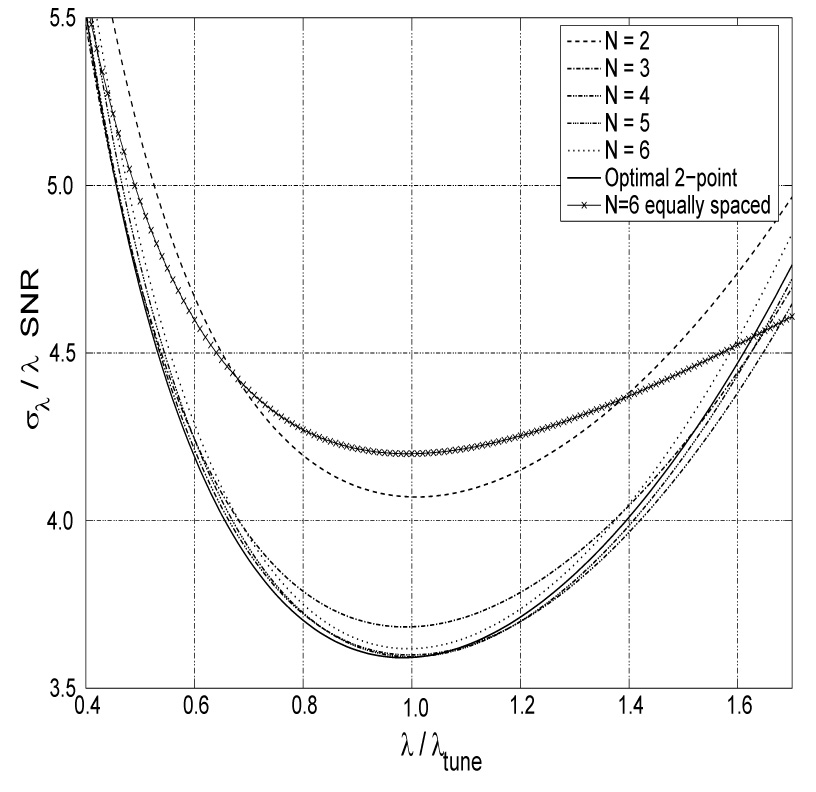
Fig. 1.

Precision as a function of λ for several N-point protocols tuned for λtune. Here, the SNR is the signal-to-noise ratio of the average of N images with minimal exponential weighting and in general is a function of λ if the minimal weighting is not zero. Note that the precision of protocols with N ≥ 3 is already very close to optimal. Since the convexity of the curves is very small, the precision stays within 15% of the best over a broad interval λ ∈ (0.6, 1.5)λtune. As an example of a commonly used scheme, the precision for optimal 6-equally-spaced-point protocol is superposed.
