
Figure 2.
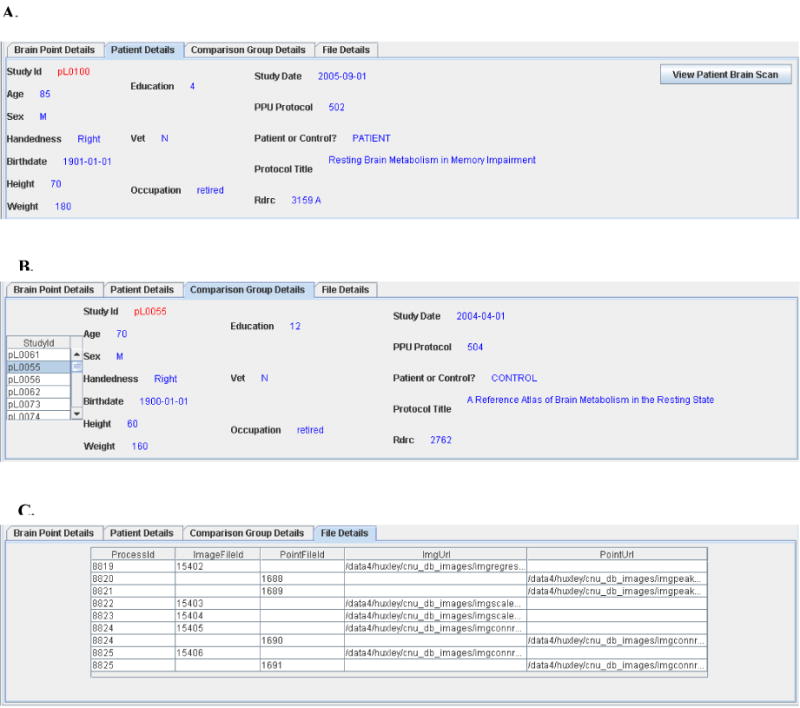
Patient and comparison group demographics and file creation details can be viewed in the lower pane of the interface. Part A displays the patient demographics. Part B displays the demographics for each member of the comparison group. Part C displays information about all physical files created during this comparison.