
Figure 4.
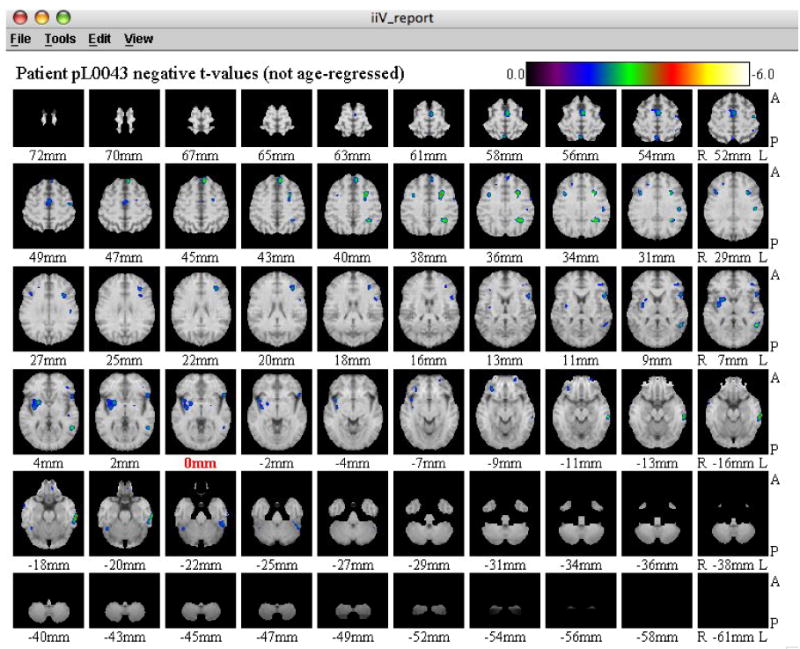
The whole brain image display. Users can view every transverse slice of the resulting t-image overlayed on a magnetic resonance image. The center slice label at 0mm is shown in red. A= anterior; P=posterior; R=Right; L=Left.
Official websites use .gov
A
.gov website belongs to an official
government organization in the United States.
Secure .gov websites use HTTPS
A lock (
) or https:// means you've safely
connected to the .gov website. Share sensitive
information only on official, secure websites.
The whole brain image display. Users can view every transverse slice of the resulting t-image overlayed on a magnetic resonance image. The center slice label at 0mm is shown in red. A= anterior; P=posterior; R=Right; L=Left.