
Figure 3.
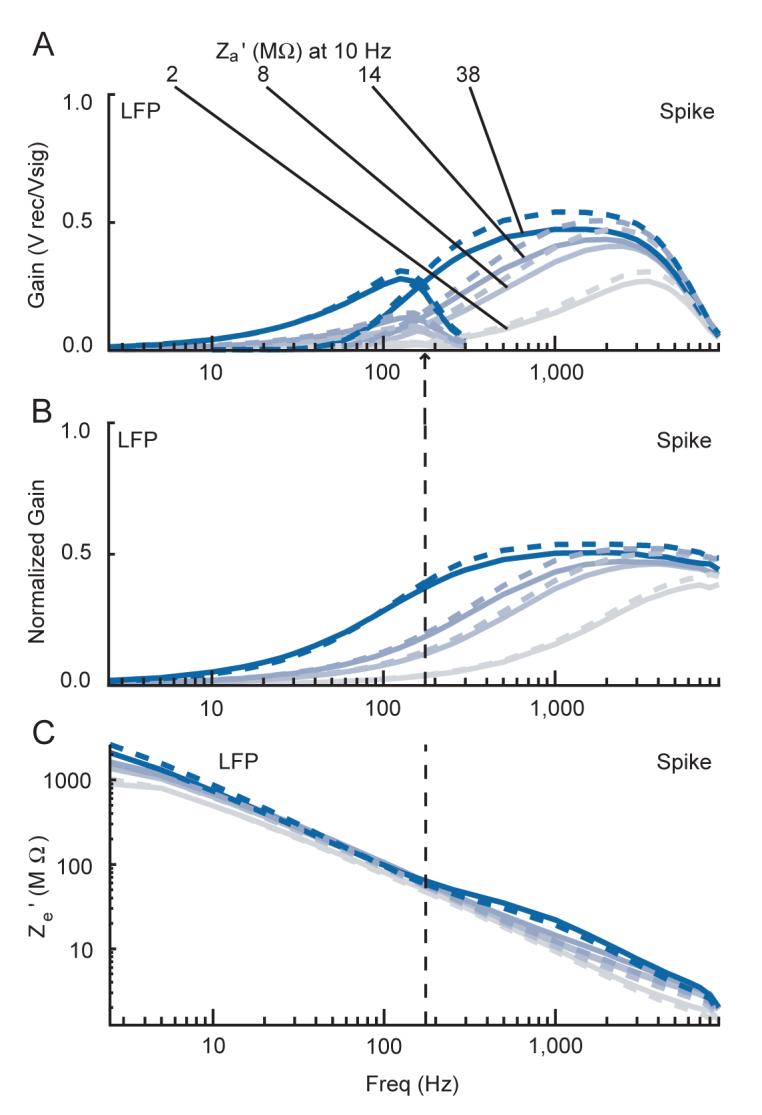
Measurement of effective electrode impedance for one electrode. Plots show amplitude data from signals recorded with one high impedance glass-insulated electrode in dilute saline using different manipulated values of Za’ with the low input impedance head-stage. Line colors are coded from grey to blue based on the value of Za’ at 10 Hz, with the precise values for each line indicated in A. Parallel configuration data is shown with solid lines, series configuration data is shown with dashed lines. Spike and LFP channel data (see Methods) are shown overlapping in A, but in B and C the vertical dashed line denotes the point where data to the left corresponds to the LFP channel data only, and data to the right corresponds to the spike channel data only. Frequency is shown on a log scale. For a list of the exact frequencies tested, please see the Signals used subsection in the Methods section. A: raw gain of the recorded over the actual signal. B: normalized gain showing the voltage attenuation across the electrode, given by the value in A for each recording divided by the raw gain of the reference recording, which was done with a steel pin with negligible impedance. C: effective electrode impedance (Ze’) calculations derived from the above data for each trace. Ze’ is shown on a log scale.