
Figure 7.
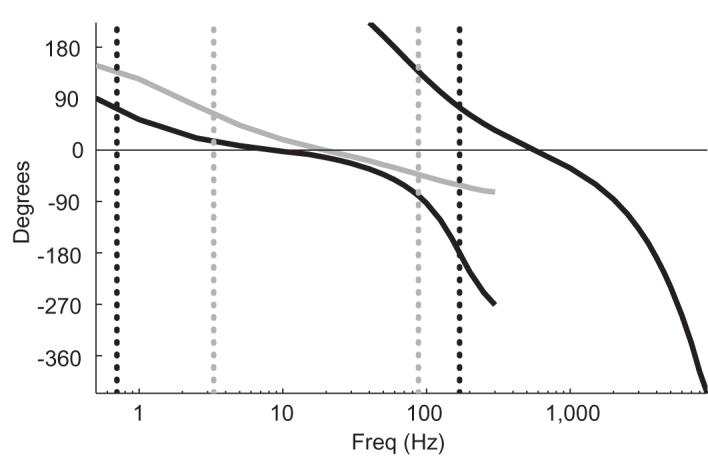
Filter-induced phase shifts. The recorded phase shifts of signals sent directly into head-stages used with different analog filters are shown, with spike and LFP channel data overlapping. A positive phase means that the recorded signal leads the actual signal. Frequency is shown on a log scale. For a list of the exact frequencies tested, please see the Signals used subsection in the Methods section. Both head-stages were used through-out this study with following preamplifiers with identical specified filter properties, which had resulting phase shifts shown here in black. The data above 10 Hz were recorded using the low input impedance head-stage, and the data at and below 10 Hz were recorded with the high input impedance head-stage which has no series capacitance that introduces additional phase shifts in this frequency band. (see Figure 10) This black line was used as the purely filter-induced reference phase and subtracted from other data recorded with this equipment to determine the phase shifts introduced by other sources. The grey line shows the LFP channel phase shifts recorded for a second preamplifier with the high input impedance head-stage. The dotted vertical lines show the cut-off frequencies for the LFP channel filter with its phase response shown in the corresponding color.