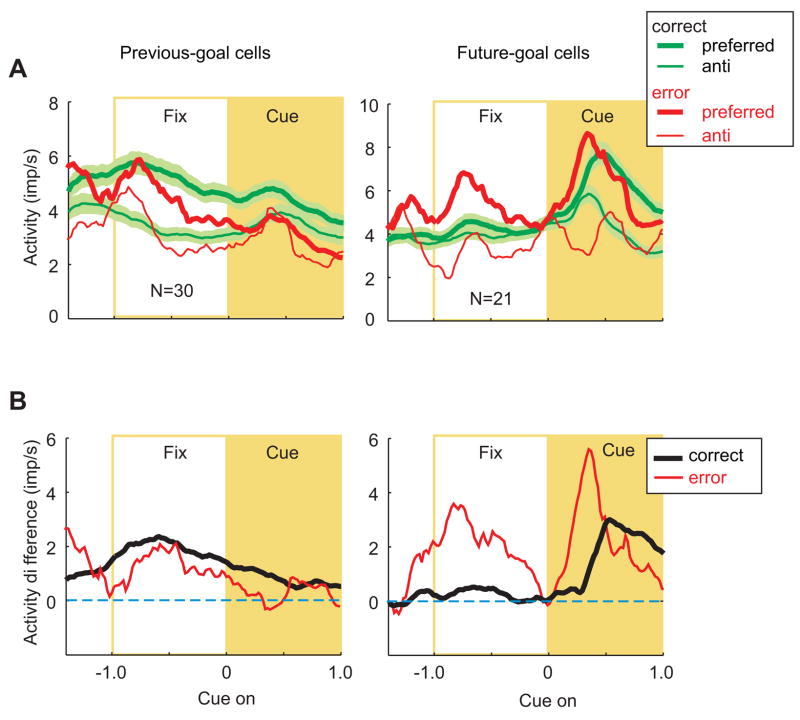
Figure 4.
Previous- and future-goal selectivity. A. Population averages for preferred goals (thick line) and anti-preferred goals (thin lines). Mean discharge rate (bin width, 200 ms) for correct trials (green lines), with the standard error depicted by the shading, and for error trials (red lines). For both previous-goal cells (left) and future-goal cells (right), averages are aligned on cue onset. Abbreviations as in Figs. 2 and 3. B. Difference in activity between preferred and anti-preferred goals for correct (black) and error (red) trials.

