
FIGURE 5.
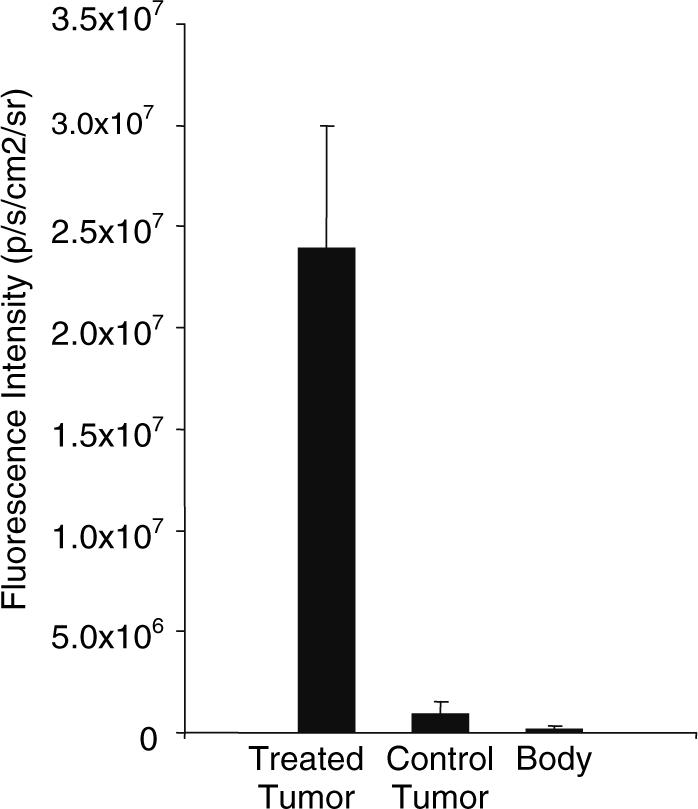
Graph of tumor to body ratios from NIR imaging. The ratios of irradiated tumor, control tumor and the rest of the body per kilogram of body weight are shown. The ratio of fluorescence intensity of the irradiated tumor to the control tumor is approximately 25:1, and the ratio to the rest of the body is over 100:1.