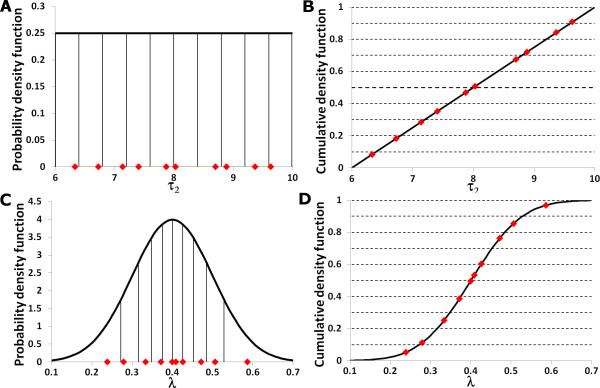
Figure 2.
Examples of the probability density functions ((a) and (c)) and cumulative density functions ((b) and (d)) associated with parameters used in Figure 1; the black vertical lines divide the probability density functions into areas of equal probability. The red diamonds depict the location of the samples taken. Since these samples are generated using Latin Hypercube sampling there is one sample for each area of equal probability. The example distributions are: (a) A uniform distribution of the parameter τ2, (b) the cumulative density function of τ2, (c) a normal distribution function for the parameter λ, and (d) cumulative density function of λ.

