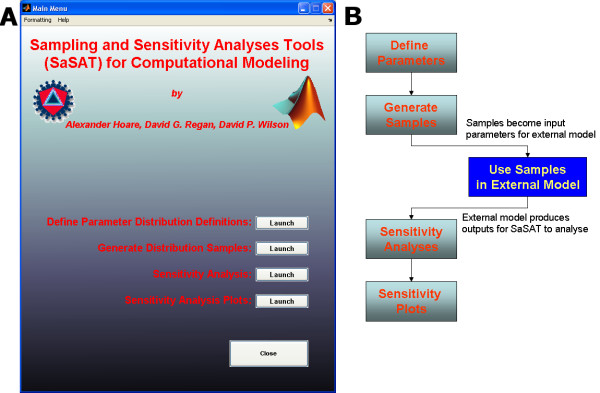
Figure 3.
(a) The main menu of SaSAT, showing options to enter the four utilities; (b) a flow chart describing the typical process of a modelling exercise when using SaSAT with an external computational model, beginning with the user assigning parameter definitions for each parameter used by their model via the SaSAT 'Define Parameter Distribution' utility. This is followed by using the 'Generate Distribution Samples' utility to generate samples for each parameter, the user then employs these samples in their external computational model. Finally the user can analyse the results generated by their computational model, using the 'Sensitivity Analysis' and 'Sensitivity Analysis Plots' utility.

