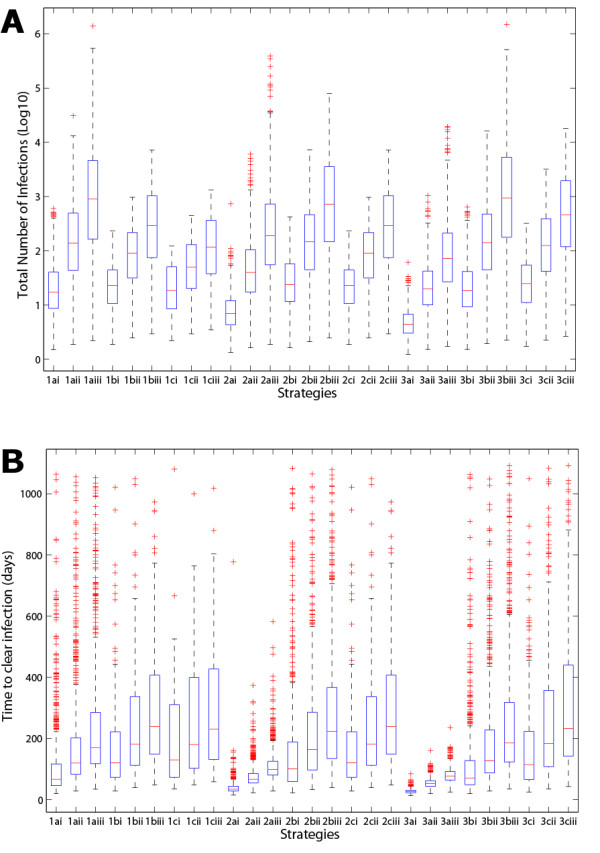
Figure 6.

Box plots comparing the 27 different strategies used in the example model, with the whisker length set at 1.5 multiplied by the inter-quartile range, and red '+' showing the outliers: (a) the total number of infections caused by each strategy on a log10 scale, (b) the total time to clear the infection for each strategy.
